Audio technology / Audio analysis
Rhythm-game calibration: mean, median and timing error
Most taps land slightly late, but one lands much later. A single average hides part of that story. This guide uses seven hypothetical inputs to compare the mean and median, then plots what remains after a 45 ms correction on the same axis.
Article summary
- State how tapping error is measured and the combined human/device conditions.
- Check the fictional sample's mean of 61 ms and median of 45 ms.
- Read residual e−c alongside the range, then retest by condition.

CAT BEAT : Wake the Beat · Development screenshot
Practice mode's guidance and Perfect feedback provide context for recording repeated inputs. The calculations use a separate hypothetical sample.
Image credit: Level Up Today · Source page ↗ · Original image ↗

Repeated slight lateness and one much later input
The Practice screen displays repeated targets and input results. An actual calibration study would collect repeated records with the same pattern, output and input method, first stating the timing reference used for errors. The seven values here are fictional samples created to explain the calculation.
Calibration moves the entire distribution earlier or later. Subtracting a fixed value leaves the distance between attempts unchanged. Plotting the center and individual values together shows what that correction moves and what still needs investigation.
Define what contributes to the measurement
A tapping result combines sound and visual cues, anticipation, input hardware and software delivery. Tapping to a predicted beat measures a different task from reacting after a signal. Define the task before calling its error device latency or reaction time.
Convert targets and inputs to the same time basis and define e=input−target. getOutputTimestamp maps audio and performance times for output frames. A physical-output-latency test separately defines sensors and its start and end events.
Related primary sources: MDN · getOutputTimestamp() ↗
Seven hypothetical trials shifted by 45 ms
| Trial | Original error (ms) | Residual (ms) |
|---|---|---|
| 1 | 41 | −4 |
| 2 | 43 | −2 |
| 3 | 44 | −1 |
| 4 | 45 | 0 |
| 5 | 46 | 1 |
| 6 | 48 | 3 |
| 7 | 160 | 115 |

DJMAX RESPECT V · Official PC screenshot
A screen showing the hit line and input feedback. Calibration controls, timestamp logs and device-latency measurements need separate evidence.
Image credit: NEOWIZ / Steam · Source page ↗ · Original image ↗

Verify the mean of 61 ms and median of 45 ms
The values 41, 43, 44, 45, 46, 48 and 160 ms sum to 427 ms, giving a mean of 61 ms. The fourth, middle value of the seven sorted observations is 45 ms. In this distribution containing 160 ms, the mean and median occupy different positions.
NIST discusses measures of location in relation to distribution shape and extreme values. This example compares two candidate measures and flags the 160 ms event for checks of load, input and conditions. Set exclusion criteria before calculating, and retain the reasons for any exclusions.
Related primary sources: NIST · Measures of Location ↗
Before and after a 45 ms correction on the same axis
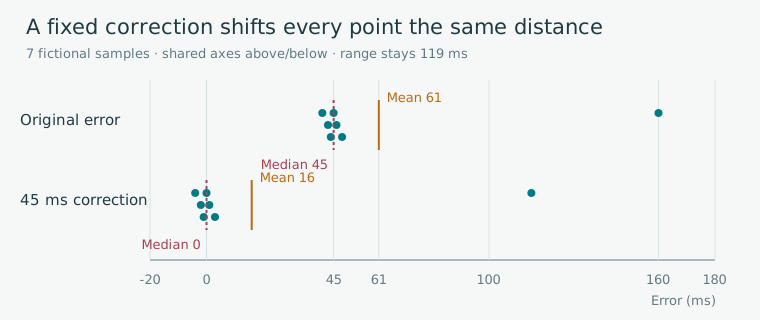
Editorial diagram · All seven fictional errors shift by 45 ms. The original mean is 61 ms and median 45 ms; afterward the mean is 16 ms and median 0 ms.
Horizontal axis: error relative to target (ms), shared by both rows. Groups show before and after correction; each circle is one fictional input. Nearby points are separated vertically.
On smaller screens, scroll the diagram horizontally. Enlarge diagram ↗
Values and sequence shown in the diagram
- Original: 41, 43, 44, 45, 46, 48, 160 ms
- Residual: −4, −2, −1, 0, 1, 3, 115 ms
- Range remains 119 ms
Define the correction sign and shift values on the same axis
The convention here is residual r=e−c. Applying c=45 ms produces −4, −2, −1, 0, 1, 3 and 115 ms. An input previously at 45 ms becomes 0; the 160 ms input remains at 115 ms.
The original range 160−41=119 ms equals the residual range 115−(−4)=119 ms. The fixed shift changes location. A game setting that moves target times may use a different sign convention, so compare the actual direction of change using known early and late inputs.
Investigate large residuals using event records
A residual of 115 ms can have more than one explanation. Compare event timestamps with frame delays, cue visibility and changes in audio output. The before/after plot shows which values shifted and how their relative positions remained.
Collect fresh records for wired output, device speakers, wireless output, browsers and load conditions separately. Show individual summaries, all recorded points and sample counts together. Retest whether a correction chosen under one condition still fits another.
Similar centers, different variation
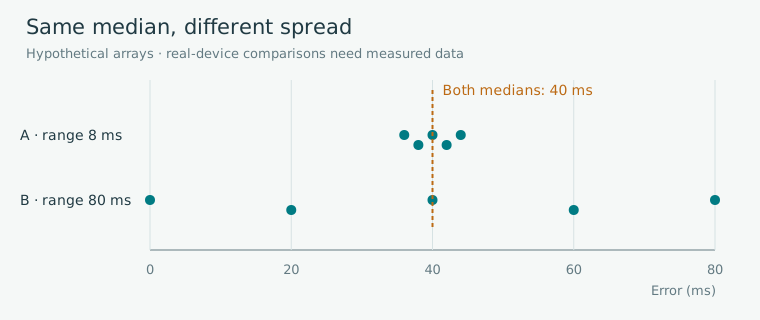
Editorial diagram · Synthetic points in conditions A and B separate location from spread. They are not measurements ranking particular output devices.
Horizontal axis: input error (ms), with identical limits. Each dot represents a hypothetical trial.
On smaller screens, scroll the diagram horizontally. Enlarge diagram ↗
Values and sequence shown in the diagram
- A: 36, 38, 40, 42, 44 ms; median 40 ms, range 8 ms
- B: 0, 20, 40, 60, 80 ms; median 40 ms, range 80 ms
Provide a default value and a route to retesting
The calibration UI can show the current value, unit, direction of adjustment and a reset to default. Test records should identify the cue, device, attempt, build, date and correction. Compare the numerical shift with an actual input task under the same conditions.
These seven fictional values illustrate summary measures and sign conventions. Establish production correction values and repetition counts in the target environment. Record calculation checks, subjective input tests and physical measurements separately.
Measurement definitions in a calibration record
| Item | What to specify |
|---|---|
| Target event | Chosen reference in the music file or output timeline |
| Input event | Normalized event and clock |
| Cue | Auditory, visual, combined or anticipation task |
| Environment | Device, browser, input/output and load |
| Calculation | e=input−target, r=e−c, unit ms |
| Review | Sample count, all points, summary measures, spread and exclusion reasons |
Sources & scope
Sources reviewed 2026.10.17: NIST's explanation of means, medians and extreme values, and the return quantities and units of getOutputTimestamp. The seven values and 45 ms shift are original learning examples. Actual human/device data, recommended device-specific corrections and sample counts require separate measurement.