Music production / Music guide
Why music loops break: duration, waveforms and reverb
A click at the loop boundary calls for a different investigation from timing drift that grows on every repetition. Start with the symptom, then check bars, frame counts, loop ranges, waveforms and resume behavior.
Article summary
- At 48 kHz, 8 seconds is 384,000 frames.
- Distinguish the initial playback interval from the repeating period.
- Connect calculation checks with actual repeated listening.
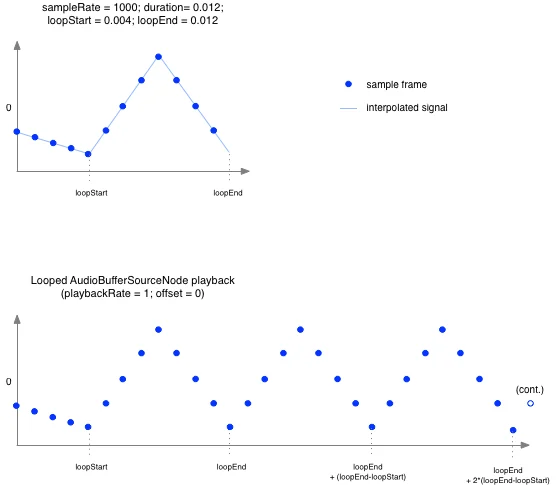
Web Audio API 1.1 · AudioBufferSourceNode playback example
The official diagram uses a sample interval of 1 ms, a total length of 12 ms and a loop range of 4–12 ms. Distinguish the initial playback from the 8 ms repeating interval.
Image credit: W3C Web Audio Working Group · W3C Document License · Source page ↗ · Original image ↗ · Document license ↗

Listen for drift, clicks and cut-off tails
If playback starts in sync but shifts on each repetition, check the beat origin and loop period. A short click points to a waveform discontinuity; an abruptly cut-off tail points to reverb and edit boundaries. If sound doubles after resuming, first count the active sources.
Replay the boundary several times through the same audio output and log where each symptom occurs. Distinguishing accumulating beat error, clicks, truncated reverb and overlapping sources helps narrow the investigation.
Convert bar duration to a frame count
At a fixed 120 BPM, counting a quarter note as one beat, four bars of 4/4 last 8 seconds. In 48,000 Hz PCM, that is 384,000 frames along the time axis. A stereo frame contains two values, one for each channel, so there are 768,000 sample values in total. Distinguish frame count from the number of channel values.
Export using a whole number of frames. If the calculated count is fractional, record the rounding choice and resulting duration. Web Audio's loopStart and loopEnd specify boundaries in seconds, and the specification also covers positions between samples. Record the integer edit boundary and API time arguments separately.
Related primary sources: W3C · AudioBufferSourceNode Looping ↗ · MDN · loopStart ↗
Units for 8 seconds of 48 kHz PCM
| Item | Value | Meaning |
|---|---|---|
| Frames | 384,000 | Number of positions along the time axis |
| Mono sample values | 384,000 | 1 channel per frame |
| Stereo sample values | 768,000 | 2 channels per frame |
| Loop period | 8 s | Assuming 16 beats at a fixed 120 BPM |

CAT BEAT : Wake the Beat · Development screenshot
A development scene that provides context for looping music. File-seam measurements and listening results are separate evidence.
Image credit: Level Up Today · Source page ↗ · Original image ↗

Separate the first pass from later loops
W3C's buffer diagram uses 1,000 Hz, a duration of 0.012 seconds and a loop range of 0.004–0.012 seconds. In milliseconds, initial playback runs from 0 to 12 ms, then subsequent repetitions run from 4 to 12 ms. The start boundary is included; reaching the end boundary returns playback to the start.
The diagram below transfers this principle to an original model of a longer musical segment: an introduction from 0–4 seconds and a loop from 4–12 seconds. After the first 12 seconds, playback returns to 4 seconds, producing an 8-second period. Calculate total elapsed time including the introduction separately from file position during the loop.
Related primary sources: W3C · AudioBufferSourceNode Looping ↗
Play the introduction once, then repeat the same interval
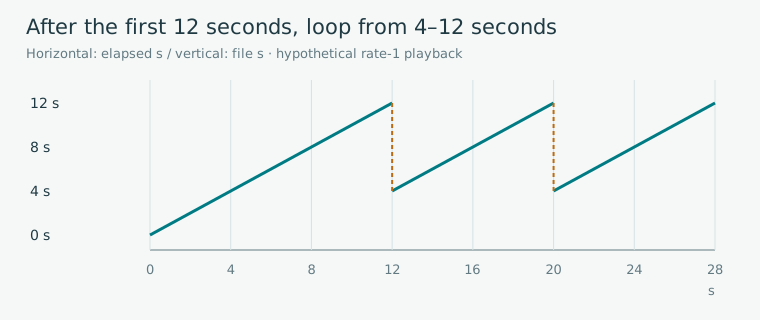
Editorial diagram · A hypothetical musical segment starting at 0 seconds and looping from 4–12 seconds. W3C's millisecond illustration is expanded into an explanatory model in seconds.
Horizontal axis: elapsed playback time (seconds). Vertical axis: file position (seconds).
On smaller screens, scroll the diagram horizontally. Enlarge diagram ↗
Values and sequence shown in the diagram
- Elapsed 0→12: file 0→12
- Elapsed 12→20: file 4→12
- Elapsed 20→28: file 4→12
Address waveform and reverb boundaries
In the hypothetical waveform, an ending value of +0.5 meets a starting value of −0.5, a difference of −1.0. That jump is a clue when investigating a click. How audible it becomes also depends on frequency, level and audio output, which need checking alongside the two plotted values.
A short fade lowers amplitude at the boundary but can change the attack. A crossfade overlaps segments, affecting their combined level and musical position. A separate, continuing reverb path is another option. Compare beat alignment, attack, peaks and the seam together when evaluating a fix.
Boundary jumps and a possible fade
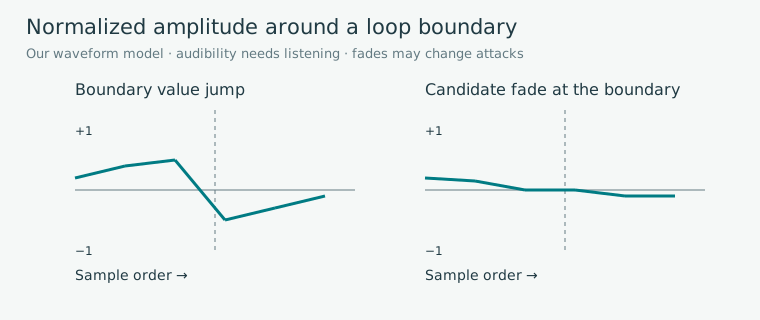
Editorial diagram · An original waveform model connecting an ending value of +0.5 to a starting value of −0.5. The right side conceptually adjusts boundary values toward 0.
Horizontal axis: sample order around the boundary. Vertical axis: normalized amplitude, −1 to 1. Left: value jump. Right: conceptual fade candidate.
On smaller screens, scroll the diagram horizontally. Enlarge diagram ↗
Values and sequence shown in the diagram
- Original boundary difference: −1.0
- A fade changes the boundary, attack and level together.
Check the source lifecycle during interruption and return
On resuming, establish the saved file position and the new source's start reference. Assign responsibility for clearing previous sources, scheduled work and effects. Check the file's loop boundaries separately from the application's interruption state.
The illustrative policy pauses music and notes together, saves file position and starts one new source at the ready display. An actual product sets its policy according to play rules and browser state.
Record the edited file and playback results together
Record the file hash, sample rate, channel count, frame count, beat origin and loop start and end. Under the same conditions, test the loop alone, with effects and after an interruption. Give each symptom a boundary number and timestamp.
Check duration and boundary arithmetic automatically, then listen repeatedly for attack changes, reverb continuity and clicks. Use game images for context, specification diagrams for range definitions, and waveforms and logs for the actual file's behavior.
Different symptoms call for different evidence
| Symptom | Record | Check |
|---|---|---|
| Beat shifts on each repetition | Beat origin, period and repetition number | Accumulated position after n repetitions |
| Boundary click | Samples around the boundary and output conditions | Waveform and repeated listening |
| Truncated reverb | Reverb region and edit boundary | Continuity of the tail |
| Overlap after resuming | Source count and cleanup time | Resume state with one source |
Sources & scope
Sources reviewed 2026.10.17: W3C's looping section and buffer diagram, and MDN loopStart. Calculations involving seconds, frames and channels, and the boundary waveform, are original models. The diagrams explain principles separately from listening results for any particular recording.